2 years ago
Re-usable easy interface JavaScript chart library, based on D3 v4+
2 years ago
A composable charting library built on React components
2 years ago
Hooks for building lightweight, fast and extendable datagrids for React
2 years ago
Apache ECharts, a powerful, interactive charting and visualization library for browser

2 years ago
Create diagrams and visualizations using text and code.

2 years ago
Creates diagrams from textual descriptions
2 years ago
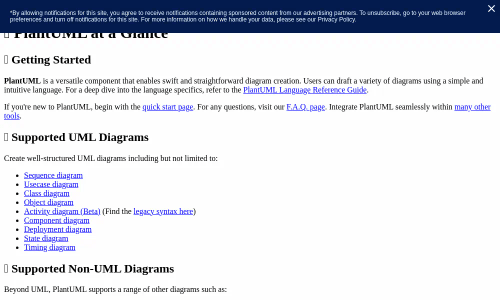
Easily create beautiful UML Diagrams from simple textual description. There are also numerous kind of available diagrams. It's also possible to export images in PNG, LaTeX, EPS, SVG.

a year ago
Chartbrew allows you to connect all your databases and APIs to create beautiful live charts and visualize your data in custom dashboards

a year ago
Simple yet flexible JavaScript charting library for the modern web

a year ago
Interactive charts and maps for Python, R, Julia, Javascript, ggplot2, F#, MATLAB®, and Dash.

a year ago
Top performance in a tiny package. Free, open-source and feature-rich. At just 45 kilobytes, the dream of super compact interactive charts is now a reality.

a year ago
ApexCharts is a a free and open-source modern charting library that helps developers to create beautiful and interactive visualizations for web pages.